Use MATLAB to plot 𝑓(𝑥) = ln(𝑥) for 𝑥 ∈ (0, 5], along with Taylor approximations around 𝑥 = 1 with 𝑛 = 0, 2, 4, 6: Maths Assignment, UOG, Ireland
| University | University Of Galway (UOG) |
| Subject | Math |
- Use MATLAB to plot 𝑓(𝑥) = ln(𝑥) for 𝑥 ∈ (0, 5], along with Taylor approximations
around 𝑥 = 1 with 𝑛 = 0, 2, 4, 6 - Use an appropriate Taylor series to write a MATLAB function M-file that approximates
𝑓(𝑥) = sin(2𝑥) for all x with a maximum error of 0.01. That is, your M-file should take
values of x as input, and return values of sin(2𝑥) as output, but should not use MATLAB’s built-in sine function i.e., sin.m. - Use numerical experiments using MATLAB to arrive at a conjecture about whether the
following infinite series converges or not.

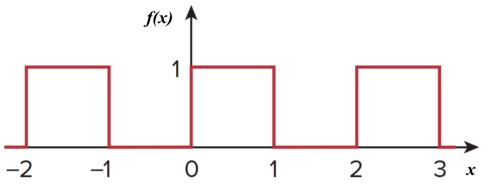
- Determine the exponential Fourier series of the waveform of the function f(x) shown in
Figure 1.
i. Obtain the expressions for the amplitude and phase spectra.
ii. Using MATLAB, plot the amplitude and phase spectra for 𝑛 = 1, 2, 3, … , 𝑁, where
𝑁 = 11.
iii. Plot the reconstructed waveform of the function for 𝑛 = 1, 2, 3, … , 𝑁, where 𝑁 = 11.
Explain the Gibbs Phenomenon from the obtained plot.

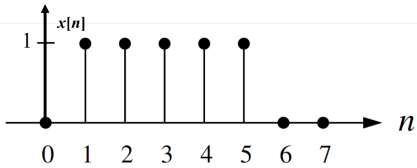
- An 8-point signal 𝑥[𝑛] is shown in Figure.

i. Using MATLAB compute DFT of 𝑥[𝑛] i.e., 𝑋[𝑘].
ii. Plot DFT magnitude and phase as functions of k.
iii. Compute and plot the IDFT of 𝑋[𝑘].
Get Help By Expert
If you're studying in Ireland and feeling overwhelmed by your assignments, you're not alone. Many students find the case study format especially challenging. That's where Ireland Assignments comes in. We provide expert help with all types of case studies, from business to law to medicine. Our literature review writers are familiar with all the major Irish universities and their specific requirements. So whether you're struggling with a group project or an individual assignment, we can give you the assignment assistance you need to succeed. We'll help you get the grades you need to make your dream of studying in Ireland a reality.


