Gage R&R Analysis: measurement System Suitability, Repeatability & Reproducibility
| University | Atlantic Technological University (ATU) |
| Subject | Metrology and Calibration |
Metrology and Calibration Assignment
Title: Gage R&R Analysis and Measurement System Improvement
1. Interpret the Results
Total Gage R&R Suitability:
- If % R & R < 10 % %R&R<10%, the measurement system is considered acceptable.
- If 10 % < % R & R < 30 % 10%<%R&R<30%, the measurement system is marginally acceptable.
- If % R & R > 30 % %R&R>30%, the measurement system is unacceptable.
Repeatability:
- This indicates the variability due to the measurement equipment.
- High repeatability means the equipment is consistent.
Reproducibility:
- This indicates the variability due to the operators.
- High reproducibility means the operators are consistent in their measurements.
2. Potential Causes of Variation
You need to explain potential causes for the observed variation, such as:
- The piece being measured: Differences in the parts themselves.
- The person taking the measurement: Operator skill, training, or technique.
- The method used: The procedure for taking measurements.
- The instrument: Accuracy, resolution, or calibration of the measuring device.
- Other factors: Environmental conditions, wear and tear, etc.
3. Suggest Improvements Based on your analysis, suggest ways to improve the measurement process to reduce variability.
For example: Better training for operators. Calibration or replacement of the measuring instrument. Standardization of the measurement procedure. Environmental controls (e.g., temperature, humidity).
Are You Searching Answer of this Question? Request Ireland Writers to Write a plagiarism Free Copy for You.
4. Use Graphs to Illustrate Create graphs to visualize the data
such as: Range charts for repeatability. Average charts for reproducibility. Interaction plots to show how operators interact with parts.
5. Write the Report Your report should include:
Introduction:
Explain the purpose of the study and the Gage R&R method.
Main Body:
Present your calculations, results, and interpretations.
Conclusion:
Summarize your findings and suggest improvements.
Graphs:
Include appropriate graphs to support your analysis.
6. Follow the Requirements Word Count:
1200–1500 words.
Formatting:
Times New Roman, size 12, 1.5 or double line spacing.
Referencing:
Use Harvard referencing style if you cite any sources.
Structure:
Ensure your report is well-organized with clear headings and paragraphs.
7. Example Calculation Here’s an example of how to calculate
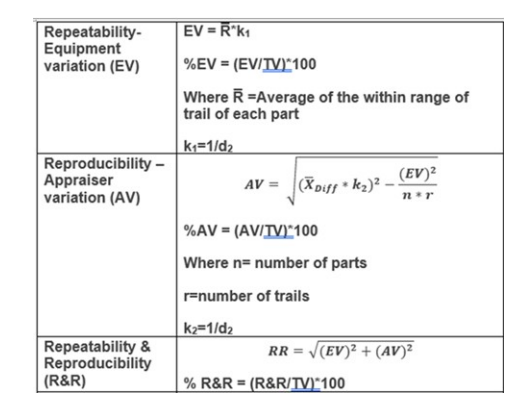
Repeatability (EV):
- Calculate the range for each part (difference between the max and min values for each part). Find the average range ( R ˉ R ˉ ).
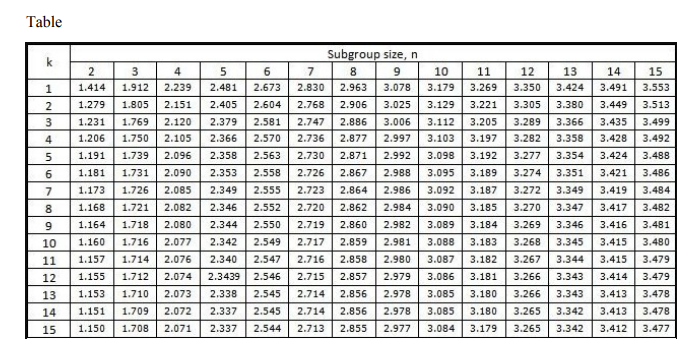
- Use the constant k 1 k 1from the table (for 3 trials, k 1 = 1 / d 2 = 1 / 1.693 ≈ 0.590 k 1=1/d 2=1/1.693≈0.590).
- Calculate E V = R ˉ × k 1 EV= R ˉ ×k 1.
Get Solution of this Assessment. Hire Experts to solve this assignment for you Before Deadline.
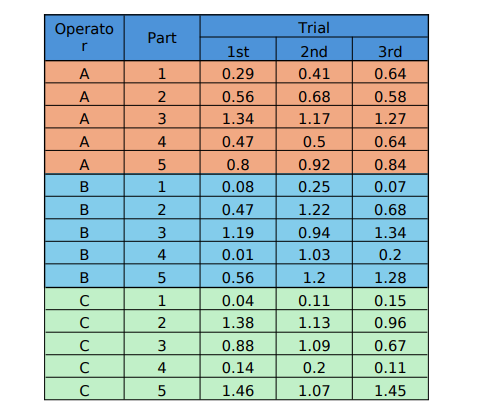
An engineer selects 5 parts that represent the expected range of the process variation. Three
operators measure the 5 parts, three times per part, in a random order.

Using the data provided, carry out a Gage Repeatability and Reproducibility study using Average
and Range method. Comment on
- The suitability of the Total Gage R&R
- The repeatability
- The reproducibility
- Use graphs to illustrate where appropriate.

Explain potential causes for the variation commenting on:
- The piece being measured.
- The person taking the measurement and the training received on using instrument.
- The method used for taking the measurement, the procedure used.
- The instrument itself, its stated accuracy and resolution
- Any other potential reasons for the variability
How would you improve the measurement process to decrease variation observed?
Requirements: Answer should be at circa 1200 – 1500 words
- Organization: the assignment is clearly organized. i.e., there is an introduction,
main body, and a conclusion; paragraphs are coherent. - Engagement: the assignment demonstrates engagement with relevant academic
sources and class resources. - Style and mechanics: Typed Microsoft Word (Times New Roman font, size 12, 1.5
or double line spacing; the assignment is devoid of grammatical errors, its language is
concise, and references are included as appropriate. (See Harvard Referencing
Guide).
Stuck in Completing this Assignment and feeling stressed ? Take our Private Writing Services
Marking: This assignment constitutes 30% of the overall marks for the course and will be
marked using the following criteria:

| Section | Description | Weight (%) |
|---|---|---|
| Introduction | Total for this Section: 10% | |
| Set out the aims of the assignment and signpost the argument | 2% | |
| Introduce the issue, background, and major debates | 3% | |
| Total for Introduction | 5% | |
| Overall Content | Total for this Section: 75% | |
| Evidence of understanding of subject | 20% | |
| Suitability of Total Gage R&R | 10% | |
| Repeatability | 10% | |
| Reproducibility | 10% | |
| Potential causes of variation: | ||
| The piece being measured | 5% | |
| The person/training | 5% | |
| The method/procedure | 5% | |
| The instrument (accuracy, resolution) | 5% | |
| Other potential reasons | 5% | |
| Conclusion | Total for this Section: 10% | |
| Summarize key elements of the argument | 5% | |
| Demonstrate how the question was answered | 5% | |
| Structure & Presentation | Layout, headings, referencing, visuals, grammar, spelling, etc. | 15% |
| Total Awarded | 100% | |

