Supply Chain Simulation – Demand, Safety Stock & Service Levels
| University | Technological University Dublin (TUD) |
| Subject | Logistics and Supply Chain Management |
Assignment:
- Choose one of the wholesalers
- Choose Service level (SL)
- Evaluate Safety Stock taking into account the demand uncertainty (estimate demand during lead time)
- Provide calculations and explanation
- Run a simulation experiment and observe the SL
- Explain simulation results
Problem solution
The simulation tool is Excel. You can solve this task in the PC class after the break.
Number of simulated lead time periods – 500
Random demand simulation using
=randbetween(min,max) function
- Simulate daily demand d for three particular days
- Calculate demand at lead time DL for L=3 as a sum of three independent daily demand values
- Repeat the calculations 500 times
- Design a histogram of DL
- Evaluate the safety stock for 95% SL
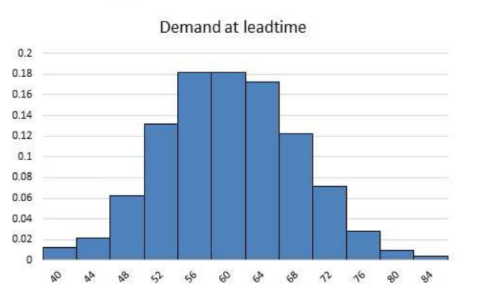
Histogram creation from simulated data
Simulation results
| Simulation number | Demand at Wholesaler | |||
|---|---|---|---|---|
| First day | Second day | Third day | Demand at Lead Time (sum of all) | |
| 1 | 19 | 16 | 28 | 63 |
| 2 | 20 | 23 | 15 | 58 |
| 3 | 17 | 26 | 23 | 66 |
| 4 | 20 | 20 | 15 | 55 |
| 5 | 18 | 24 | 23 | 65 |
| 6 | 14 | 21 | 17 | 52 |
| 7 | 22 | 24 | 18 | 64 |
| 8 | 21 | 24 | 16 | 61 |
| 9 | 25 | 13 | 13 | 51 |
| 10 | 14 | 14 | 23 | 51 |
| 11 | 22 | 14 | 12 | 48 |
min DL = 38, max DL = 82
Average DL = 58.6,
DL standard deviation
σDL = 8.03
σDL = 8.03
Are You Searching Answer of this Question? Request Ireland Writers to Write a plagiarism Free Copy for You.
Histogram creation from simulated data
Data table (may be created using EXCEL array function Frequency or Data Analysis tool Histogram):
| Bin | Lower bound | Upper bound | Number of DL observations | Histogram of simulated DL |
|---|---|---|---|---|
| Demand at leadtime | ||||
| 1 | 36 | 40 | 6 | 0.012 |
| 2 | 40 | 44 | 11 | 0.022 |
| 3 | 44 | 48 | 31 | 0.062 |
| 4 | 48 | 52 | 66 | 0.132 |
| 5 | 52 | 56 | 91 | 0.182 |
| 6 | 56 | 60 | 91 | 0.182 |
| 7 | 60 | 64 | 86 | 0.172 |
| 8 | 64 | 68 | 61 | 0.122 |
| 9 | 68 | 72 | 36 | 0.072 |
| 10 | 72 | 76 | 14 | 0.028 |
| 11 | 76 | 80 | 5 | 0.01 |
| 12 | 80 | 84 | 2 | 0.004 |
Safety stock as a percentage of lead-time demand
Average DL = 58.6, DL standard deviation = 8.03
Service level agreement is 95% (0.95 probability that the ordered goods are available at stock)
Estimated analysing simulation results Safety stock (SS) 17,
i.e. ~4.2% of DL values are larger than average + SS (or 58.6 + 17).
i.e. ~4.2% of DL values are larger than average + SS (or 58.6 + 17).
Calculated assuming that our DL is normally distributed
SS = z·σ = 1.64·8.03 = 13.2 ≈ 13
DIC_XIM
A SUPPLY CHAIN SIMULATOR. Parameters
| Factory warehouse | Distribution center | W1 | W2 | W3 | |
|---|---|---|---|---|---|
| Warehouse capacity | 4000 | 1000 | 200 | 200 | 200 |
| Initial inventory | 2000 | 200 | 50 | 20 | 20 |
| Transportation time L | 8 | 3 | 3 | 3 | |
| Backorder | No | No | Yes | ||
| Backorder cost | 4.5 | ||||
| Fixed order costs Ca (administrative costs) | 700 | 40 | 40 | 40 | |
| Holding costs (per day) Ch | 0 | 0.75 | 1 | 1 | 1 |
| Holding costs (Overstock) | 0 | 1.5 | 2 | 2 | 2 |
| Average demand D | 20 | 6 | 5 | ||
| Costs of goods sold/price | 72 | 115 | 115 | 115 | |
| Trucks | 2 | 5 | |||
| Truck capacity | 260 | 100 | |||
| Truck costs | 18 | 5 | |||
| Fixed period costs (per day) | 70 |
A Supply Chain Simulator. Dayly Demand
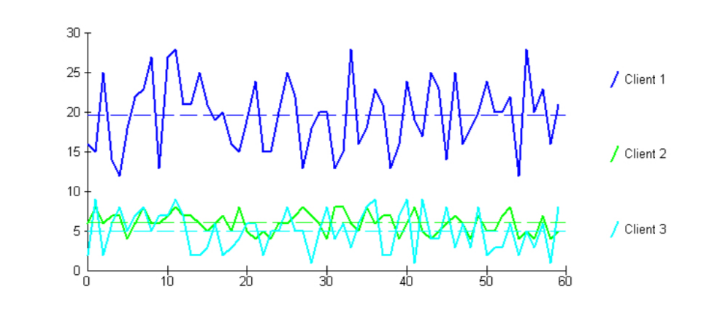
- Demand per Period (Day)
W1 Uniform between 12 and 28 W2 Uniform between 4 and 8 W3 Uniform between 1 and 9 - Client 1
- Client 2
- Client 3
Get Solution of this Assessment. Hire Experts to solve this assignment for you Before Deadline.
A Supply Chain Simulator Safety. Stock
- Choose one of the wholesalers
- Choose Service level (SL)
- Evaluate Safety Stock taking into account the demand uncertainty (*estimate demand during lead time)
- Provide calculations and explanation
- Run a simulation experiment and observe the SL
- Explain simulation results
- Provide your individual report with conclusions in ORTUS by the next lesson
A SUPPLY CHAIN SIMULATOR. Demand during lead time
Estimate demand during lead time:
- Demand during lead time (DL) is a random variable with unknown distribution function;
- Lead time is known and is constant;
- Reorder period and Lead time are not the same and may be different.
- DL distribution function can be estimated theoretically or by Excel simulation; Use the distribution from the previous practical assignment “Safety Stock”
- To use the calculations provided in the lecture we need to confirm that DL is a normally distributed random variable;
- For safety stock calculation we need the mean value of DL and the demand standard deviation σDL;
- After Safety Stock calculation we need to formulate the strategy principles for implementation with the SC simulator to provide the necessary SL.
Average DL = 58.6, DL standard deviation = 8.03
Service level agreement is 95% (0.95 probability that the ordered goods are available at stock)
Estimated analysing simulation results Safety stock (SS)
≈ 17, i.e. ≈ 4.2% of DL values are larger than average
+ SS (or 58.6+17).
≈ 17, i.e. ≈ 4.2% of DL values are larger than average
+ SS (or 58.6+17).
Calculated assuming that our DL is normally distributed
SS = z · σ = 1.64 · 8.03 = 13.2 ≈ 13
Standard Normal distribution
Z ∼ N(μ, σ) = N(0,1)
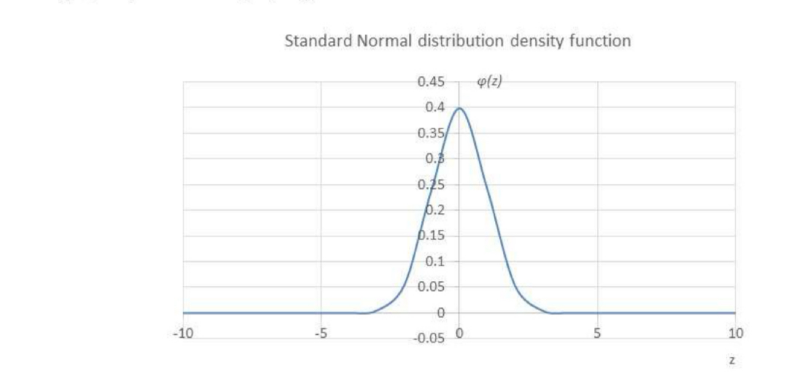
Excel function = NORM.DIST(z value, 0, 1, FALSE)